

Print Update on Availability of Corn and Soybeans for Biofuels
AgMRC Renewable Energy & Climate Change Newsletter
February 2011
 Dr. Robert Wisner
Professor Emeritus, Iowa State University
rwwisner@iastate.edu
In an article two months ago, we indicated that corn and soybean supplies for the current marketing year will be very tight by historical standards and that more corn acres almost certainly will need to be planted in 2011 to meet combined demands for biofuels and other users. Since then, USDA has issued updated estimates of last year’s U.S. corn and soybean production, South American production for this spring, and December 1 U.S. grain stocks. These updated estimates were released on January 12, 2011. In our December balance sheet projections for the 2010-11 marketing year, we showed three alternative production estimates for the 2010 crops. USDA’s season final crop estimates were lower than our low-yield scenarios. That and expectations that drought has at least modestly reduced Argentine corn and soybean production show a picture of even tighter U.S. supplies than previously expected. At the same time, cotton prices have at times this winter moved to record high levels and wheat prices have been strengthened intermittently by concerns about U.S. production prospects in the southern Great Plains as well as parts of China, Eastern Europe, and Russia.
| Due to recent USDA crop estimates and other factors, U.S. corn and soybean supplies are expected to be even tighter than previously expected. |
|---|
As a result of tightening supply prospects, the battle for U.S. crop acreage this spring is likely to be more intense than anticipated two or three months ago. There will be at least a four-way battle between corn, wheat, soybeans, and cotton for cropland. Hay prices also are strong by historical standards and may restrain farmer temptations to plant some hay land to row crops.
Importance to biofuels producers and other users
Prices from now through mid-May and weather this spring and summer will be the deciding factors in determining the cost and availability of corn and soybeans for biofuels, as well as costs to other users. These major inputs for the ethanol and biodiesel industries have been at record high levels this winter. Availability of corn and soybeans for the coming year and their prices will have a major impact on the profitability of biofuels production. Their prices and availability also will have a major impact on corn and soybean producers, industries that supply them and market grain, as well as on the profit position of other users of these crops.
Our updated balance sheets for corn/ethanol and soybean/biodiesel address the issue of supply tightness and grain prices. They also provide an early indication of acreage needs for corn and soybeans for 2011. In assessing supply-adequacy and price prospects, a two-year perspective is needed in order to help answer the question of whether the current tight supply situation is likely to be a one-year event or whether it is likely to last longer. For that reason, we also show early and very tentative projections for both 2011-12 and 2012-13 supply, demand, and carryover prospects. To provide a more accurate reading on supply tightness, we show ending carryover stocks both in bushels and in weeks’ supply.
Carryover stocks are the supply that is left over at the end of the marketing year. Marketing years for U.S. corn and soybeans end on August 31. At least a portion of the carryover stocks are needed to meet normal processing, feeding, exports and merchandising requirements until there is widespread availability of new-crop corn and soybeans. In the Midwest where most of the production occurs, harvesting of soybeans typically becomes widespread in late September. For that reason, a 3-week carryover of soybeans is considered about the absolute minimum needed by the industry. For corn, widespread Midwest corn harvesting usually starts to occur in early to Mid-October, although some August harvesting does occur in parts of the South. A 4.0 to 4.5 weeks’ carryover supply of corn normally is considered about an absolute minimum needed for corn. In the past, when smaller-scale livestock feeding was by far the largest source of demand for corn, livestock feeders had some flexibility in slowing demand in late August and September through increased use of pasture. However, with industrial corn processing rapidly overtaking livestock feeding and with large commercial feeding operations, the industry has less flexibility to reduce corn use in September than in the past.
How tight are this year’s carryover stocks expected to be?
Our current projections show potential August 31, 2011 U.S. corn carryover stocks at about a three weeks’ supply. That is extremely tight by historical standards, as shown by Figure 1. The only comparable level of stocks was in 1995-96 when carryover stocks were reduced sharply by a combination of temporary Chinese corn imports and U.S. weather and government programs that reduced domestic production. The next closest period of tight stocks was in the early 1970s with a major devaluation in the U.S. dollar and the abrupt emergence of the former Soviet Union as a huge grain importer. Figure 1 also shows our early and very tentative projections of potential U.S. corn carryover stocks in weeks’ supply for 2011-12 and 2012-13 with modestly increased U.S. corn acreage and trend yields. Our projections imply that above-normal yields will likely be needed to bring major relief from tight corn supplies in 2011-12. Trend yields used in our projections are based on the 1990-2008 trend. Actual yields have exceeded this trend two years since 2001 (by 14.8 bushels per acre in 2004 with excellent weather and by 7.4 bushels in 2009.). A U.S. corn trend yield for 2011 is 161.9 bushels per acre, which we have rounded to 162 bushels. The highest U.S. average corn yields so far were 160.4 bushels per acre in 2004 and 164.7 bushels in 2009.
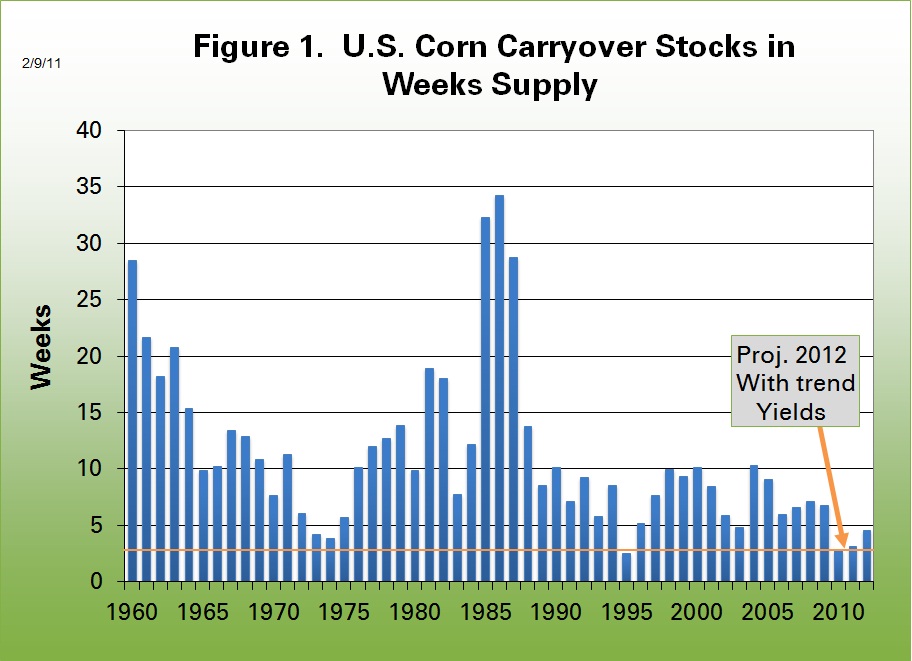
Figure 2 shows historical soybean carryover stocks in weeks’ supply along with our current projections for August 31, 2011 and early projections for the 2011-marketing year. For soybeans, indicated supplies for the current marketing year and demand indicators at this point in the season imply that U.S. carryover stocks in weeks’ supply may be the lowest on record. If so, this summer’s U.S. soybean supplies are likely to be even tighter than the low points in the early 1970s and mid-1990s. Early and very tentative indicators for 2011-12 suggest that an above-trend yield likely would be needed to bring substantial relief in the tight soybean supply next season.

Assumed 2011 Plantings
There is considerable uncertainty about 2011 crop plantings. Recent input costs including rent, fertilizer and fuel have increased sharply from last spring’s level. Corn requires more fertilizer than soybeans so that rising input costs may have some influence on farmers’ final cropping decisions along with price relationships between corn and soybeans, and spring weather. Our tentative corn projections for 2011-12 and 2012-13 are based on 3.3 million more acres or a 3.7% increase from 2010 corn plantings. That is 2 million acres less than the recent record of 93.5 million acres planted to U.S. corn in 2007. Our projected soybean supplies for 2011-12 are based on 76.5 million planted acres, 0.9 million or 1.1% less than last year. Soybean plantings in 2007, the year of record U.S. corn acreage were 11.8 million acres lower than we are projecting for 2011.
U.S. wheat plantings in 2007-08 were 1.8 acres higher than we anticipate for 2010-11. The increase in this season’s wheat acreage vs. the previous marketing year will almost certainly lead to increased double cropping of soybeans after the early summer wheat harvest. That in turn will temper the decline in soybean plantings as farmers shift some of what normally would be soybean acres to corn. U.S. cotton plantings in 2007-08, the year of record corn acres, were 1.5 million acres less than we anticipate this year.
Table 1 shows our current projected acreages of corn, wheat, soybeans, and cotton for 2011. We need to emphasize again that these acreage projections for 2011 are quite tentative and that actual plantings will be influenced by market trends, input costs, insurance provisions that affect farmers’ ability to replant failed crops, and weather. If our acreages are achieved, combined plantings of these four major crops will exceed the highs of recent years.
Table 1. Million Planted Acreage of Four Largest U.S. Crops (excluding hay)
| 2007 | 2008 | 2009 | 2010 | RW Proj. 2011 | |
|---|---|---|---|---|---|
| Corn | 93.5 | 86.0 | 86.4 | 88.2 | 91.5 |
| Wheat | 60.5 | 63.2 | 59.2 | 53.6 | 58.7 |
| Soybeans | 64.7 | 75.7 | 77.5 | 77.4 | 76.5 |
| Cotton | 10.8 | 9.5 | 9.1 | 11.0 | 12.3 |
| Total | 229.5 | 234.4 | 232.2 | 230.2 | 239.0 |
Implications
U.S. and world supplies of corn and soybeans are very tight this marketing year because of a combination of weather problems in several parts of the world, along with expanding demand for biofuels. This season’s expected growth in total use of U.S. corn is almost all in the processing of corn for ethanol. Much of the growth in demand for U.S. soybeans is coming from expanded Chinese demand although use of soybean oil for biodiesel is expected to expand because of the reinstatement of biodiesel tax credits.
Early indications are that crop plantings this coming spring and normal yields would provide only a very modest easing of the tight supplies and that additional easing would be likely to occur in 2012-13. However, one should keep in mind several important variables that may influence the degree of tightness next season, including 2011 weather and crop yields in the U.S., China, former Soviet Republics, Europe, and South America. Also, with record or near-record high corn and soybean meal prices, it likely is only a matter of time before significant rationing of feed demand begins to occur.
Another key variable is crude petroleum prices, which are influenced by the value of the U.S. dollar and international political conditions. If crude oil prices move too high for an extended period, there is a danger of short-circuiting the fragile U.S. and world economic recovery. Other variables to watch include the impact of tighter Chinese monetary policy on its economic growth and inflation rates, and the need for some financially stressed European nations to refinance debt.