

Looking at Current Ethanol Production: Top Five States
By S. Patricia Batres-Marquez
Decision Innovation Solutions
http://www.decision-innovation.com/
June 2018
As of January 2018, based on capacity data published by the Renewable Fuels Association (RFA), the U.S. ethanol industry had an existing capacity of 16.241 billion gallons per year. That includes 15.755 billion gallons per year corresponding to operating capacity and 0.486 billion per year to idle capacity. As shown in Figure 1, existing capacity increased by 1.361 billion gallons per year compared with January 2014 (14.880 billion gallons per year), while idle capacity declined from almost one billion gallons per year in January 2014 to 0.486 billion per year at the beginning of 2018 (see Figure 1). Capacity construction/expansion as of January 2018 was the largest of the previous four years with 0.465 billion gallons per year, with a total of seven plants undergoing this process. By January 2018, the United States had 201 ethanol biorefineries located across 28 states.
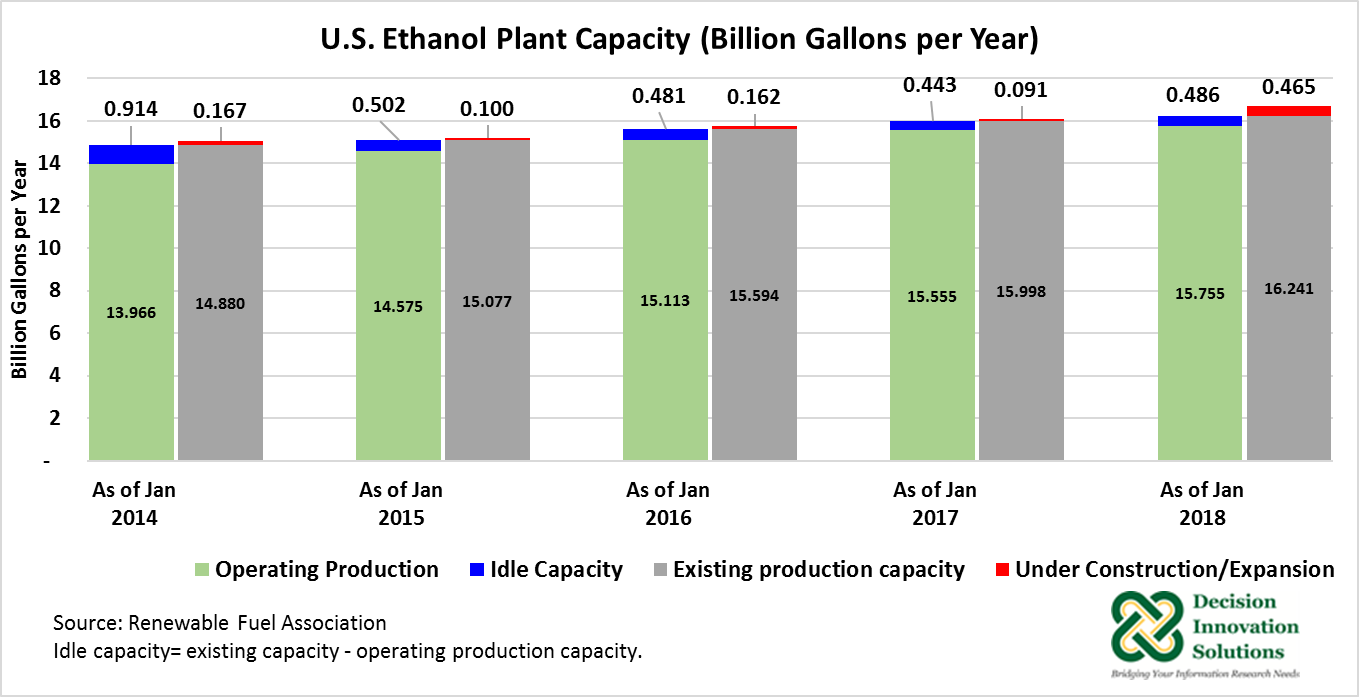
Figure 1. U.S. Ethanol Plant Capacity (Billion Gallons per Year)
Iowa continues as the leading state in ethanol plant capacity. As of January 2018, Iowa’s existing capacity was 4.177 billion gallons per year with 98.8 percent representing operating capacity (4.127 billion gallons per year) and 43 plants in operation. Iowa ethanol operating capacity represented over a quarter of U.S. total ethanol operating capacity. Also at the beginning of this year, Iowa had one plant under construction/expansion with 0.12 billion gallons per year. This volume represented 25.8 percent of total U.S. capacity under construction/expansion at that time.
Ethanol existing capacity reported for Nebraska at the start of 2018 was equal to 2.229 billion gallons per year, with an operating capacity of 2.176 billion gallons per year, for a total number of 24 plants in operation. This data indicates about 11 percent of U.S. total operating capacity was located in Nebraska at the beginning of 2018.
Besides Iowa and Nebraska, other states with large ethanol operating capacity are Illinois, Minnesota, and Indiana. As of January 2018, almost two-thirds of total U.S. operating capacity and 57.2 percent of all operating ethanol refineries (201) were located in these five states. Iowa alone had 43 ethanol biorefineries at the beginning of the current calendar year.
U.S. Ethanol Production
Fuel Ethanol Supply and Disposition data from the Energy Information Administration (EIA) released May 31, 2018, indicates U.S. annual fuel ethanol production in 2017 was equal to 15.845 billion gallons. Production increased 2.8 percent compared with 2016 (15.413 billions). Data released in May also shows U.S. ethanol refineries produced 3.955 billion gallons from January to March 2018, slightly increasing about 0.5 percent from the volume a year earlier (3.939 billion gallons). According to USDA-ERS data, during the first three months of the current calendar year, ethanol production consumed 1.383 billion bushels of corn, up 25.142 million bushels from the same period the previous year. At the same time, sorghum crushings for ethanol production declined 80 percent to 7.259 million bushels from 35.823 million bushels in the first quarter of 2017 (Figure 2).
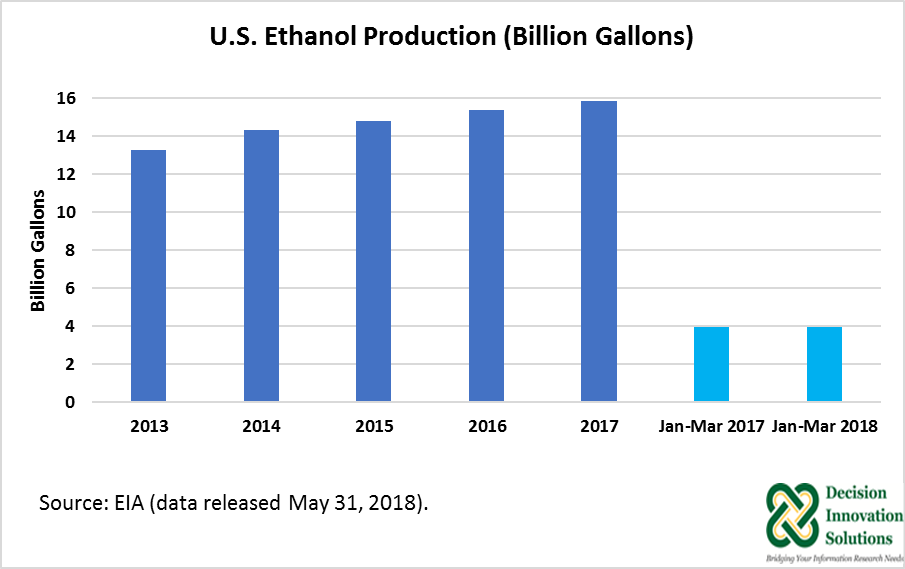
Figure 2. U.S. Ethanol Production (Billion Gallons).
State Ethanol Production
The U.S. Energy Information Administration’s (EIA) State Energy Data System for annual ethanol production is current to 2015. Ethanol production for 2016 and 2017 for the top five producers—Iowa, Nebraska, Illinois, Minnesota, and Indiana—was estimated based on each state six-year (2010 to 2015) average of total U.S. production applied to U.S. ethanol production in 2016 and 2017. Since Iowa has the largest ethanol operating capacity in the country, Iowa was the leader in ethanol production during the 2016 and 2017 years. From 2010 to 2015 Iowa’s ethanol production averaged 3.69 billion gallons, representing 26.8 percent of U.S. ethanol production (13.81 billion gallons, on average). Iowa’s production increased 5.2 percent from 2010 (3.64 billion gallons) to 2015 (3.84 billion gallons). Iowa’s ethanol production during 2016 and 2017 was estimated (on average) at record volumes of 4.1 billion gallons and 4.2 billion gallons, respectively. At this rate, Iowa’s ethanol biorefineries processed (on average) 1.415 billion bushels of corn in ethanol manufacturing in the 2016 calendar year and 1.471 billion bushels in 2017.
Nebraska, the second largest ethanol producer in the country, generated about 1.86 billion gallons, on average, from 2010 to 2015, with a 13.5 percent share of U.S. production during that period. Nebraska’s ethanol production was up 9 percent from 2010 (1.77 billion gallons) to 2015 (1.93 billion gallons). Nebraska’s production in 2016 and 2017 was estimated (on average) at 2.07 billion gallons and 2.13, correspondingly. Based on these estimates, the number of bushels of corn used (on average) by Nebraska ethanol biorefineries was about 711.8 million in 2016 and 740.2 million in 2017.
In addition, from 2010 to 2015, ethanol production in Illinois, Minnesota, and Indiana averaged 1.31, 1.13, and 0.96 billion gallons, respectively. Production estimates for 2016 and 2017 for these three states averaged 1.48, 1.27, and 1.09 billion gallons, correspondingly (Figure 3).
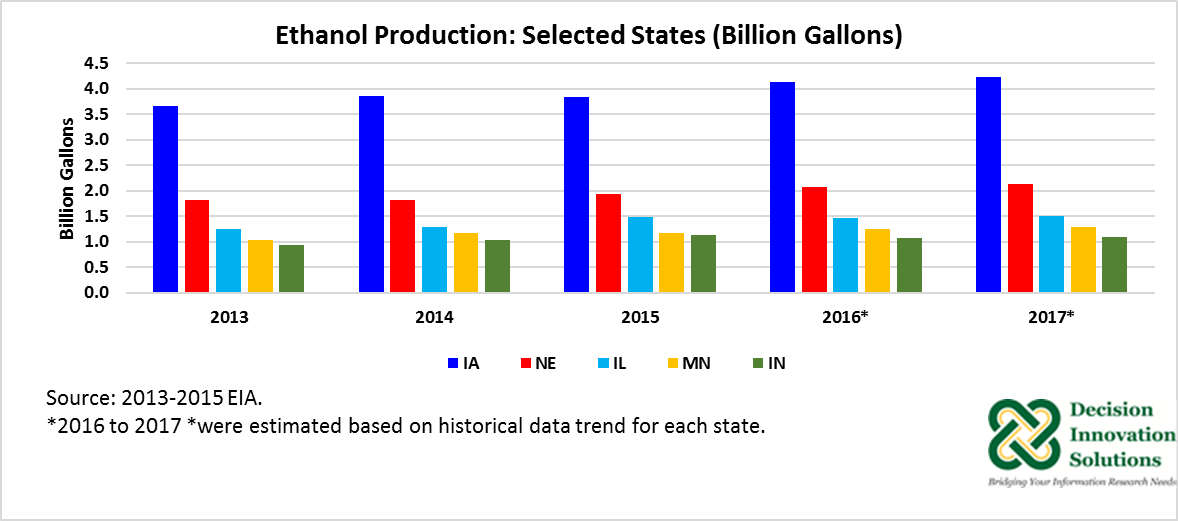
Figure 3. Ethanol Production: Selected States (Billion Gallons)
Final Comments
Instead of publishing monthly ethanol production by state, EIA publishes monthly ethanol production by Petroleum Administration for Defense District (PADD). The 50 U.S. states and the District of Columbia are split into five districts, with PADD 1 further divided into three subdistricts. PADDs 6 and 7 include U.S. territories. PADD 2 corresponds to the Midwest and includes 15 states: Illinois, Indiana, Iowa, Kansas, Kentucky, Michigan, Minnesota, Missouri, Nebraska, North Dakota, Ohio, Oklahoma, South Dakota, Tennessee, and Wisconsin.
PADD 2 ethanol production in the first quarter of 2018 was up about 1 percent to 3.634 billion gallons year-over-year (3.606 billion gallons). Most ethanol production takes place in the PADD 2 region. As indicated by this data, PADD 2 produced 91.5 percent and 91.9 percent of total U.S. ethanol production during the first quarter of 2017 (3.939 billion gallons) and 2018 (3.955 billion gallons), respectively.
Ethanol production for Iowa, Nebraska, Illinois, Minnesota, and Indiana during the first quarters of 2017 and 2018 was estimated based on the operating capacity of all U.S. ethanol biorefineries at the beginning of each year as reported by RFA, plus EIA U.S. ethanol production data during the first quarter of 2017 and 2018. Production for the first quarter of these two years was estimated by multiplying each state’s share of total U.S. operating capacity as of January 2017 and 2018, times the corresponding total U.S. ethanol production in the first quarter of 2017 and 2018. As indicated in Figure 4, Iowa production in the first quarter was up about 2 percent to 1.04 billion gallons compared with the same period a year earlier. In addition, Nebraska’s ethanol production rose about 1 percent to 0.55 billion gallons during January to March 2018 relative to the same period in 2017. Overall, ethanol production for the top five ethanol producing states during the first three months of 2018 represented 71.4 percent of PADD 2 production, and 65.6 percent of total U.S. ethanol production.
Based on the latest Short-Term Energy Outlook (STEO) published by EIA June 12, 2018, U.S. ethanol production would average 1.04 million barrels per day, compared with an average 1.03 million barrels per day in 2017, indicating about a 1.0 percent increase year-over-year.
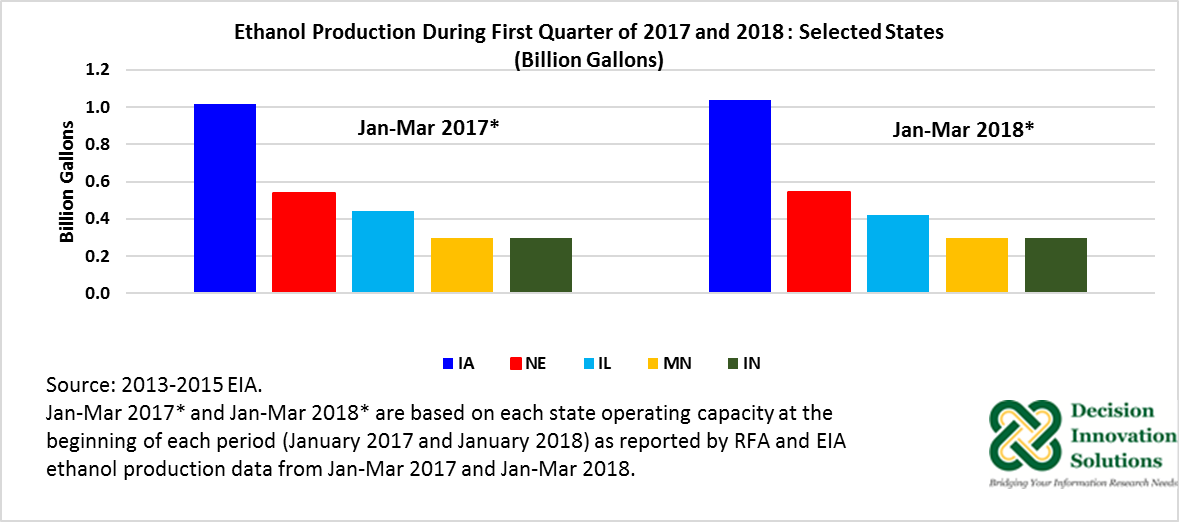
Figure 4. Ethanol Production During First Quarter of 2017 and 2018: Selected States (Billion Gallons)
Recommended Citation
Batres-Marquez, S. Patricia. 2018. “Looking at Current Ethanol Production: Top Five States." Renewable Energy Report, Agricultural Marketing Resource Center, Iowa State University. June 2018.